
Research · NIFTY 50
Markets, studied like engineering
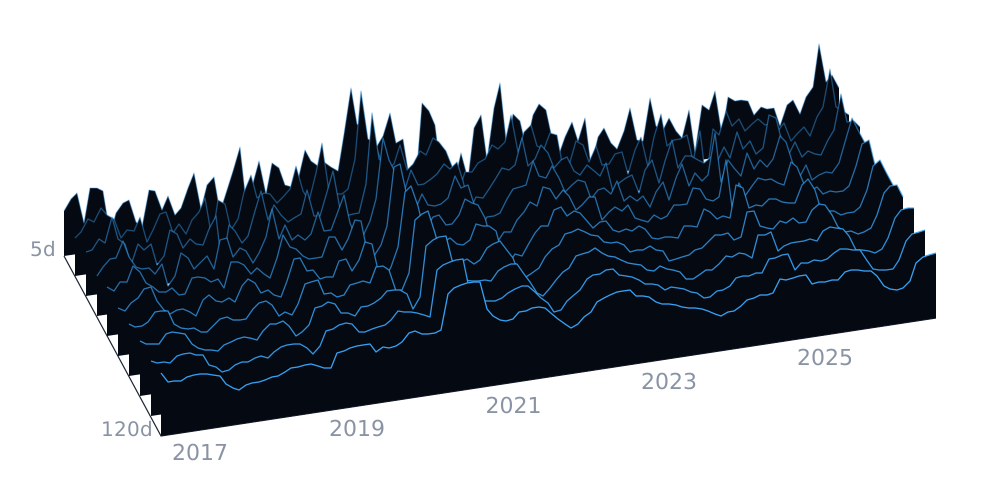
For 3+ years I've researched how markets behave — equities, options and futures — as a systematic, data-driven discipline: form a hypothesis, test it against data, and pay attention to where it breaks. This surface shows one of the most basic things a test has to respect: how much the market moves, and how that changes over time.
- 5-day
- 66.9%
- 20-day
- 83%
- 120-day
- 36.1%
Static view. On a desktop browser, an interactive 3D version loads after the page settles.
How to read it
NIFTY 50 realised volatility surface
Each ridge is one rolling window, from 5 trading days at the back to 120 at the front. Left to right is time, from Jul 2016 to Jun 2026. Height is annualised volatility on a log scale, so calm years keep their texture next to the 2020 spike. Short windows react fast and look jagged; long windows are smooth and slow.
- Highest reading: 100.2% annualised (10-day window, Mar 2020).
- Calmest 20-day reading: 5.6% (Jun 2017).
- Median 20-day volatility across the period: 11.9%.
- Latest month in the data: 11.5% 20-day (Jun 2026).
Method
How the surface is built
- Daily closes of the NIFTY 50 index (2,583 trading days).
- Daily log returns: ln(close ÷ previous close).
- For each month-end and each window (5, 10, 15, 20, 30, 40, 60, 80, 100, 120 trading days): the sample standard deviation of the last N returns, × √252 to annualise.
- The data stops at Jun 2026 — at least 3 months before today — and only these derived values are published, never raw prices.
Source: NIFTY 50 index (^NSEI) daily closes via the public Yahoo Finance chart endpoint. Grid: nifty-volatility-grid.csv. Regenerated 2026-09-30.
Limitations
What this doesn’t tell you
- It is index-level only; individual stocks behave very differently.
- Close-to-close returns ignore intraday swings and gaps inside the day.
- Annualising with √252 assumes returns are independent — they often aren’t.
- Past volatility is a description, not a forecast.
Research on this site reflects personal study and experimentation. It is not investment advice or a guarantee of future performance.
Written by